Skip to content
    Truven-icon
    Employer and health plan analytics

    Payer analytic spotlight

    Winter 2026 | Issue 10

    IMG-Truven-Web-QS-003-900x830
    Table of Contents
    Share via

    In this issue

    Each quarter, Truven publishes fresh insights on healthcare trends from our Analytic Advisory and Consulting team.  

    In this edition, our experts cover:  

    The Truven Health Trends webinar recap 

    This is a recap of the January 2026 Truven Health Trends webinar, where our experts discussed weight loss drugs and gene therapies, mitigating high-cost claimants, optimizing plan design, and influencing member behavior to contain cost growth.  

    Managing GLP-1s 

    A deep dive into managing GLP-1s and how employers and health plans can build sustainable benefit structures that support member health while managing escalating costs. 

    The next frontier: Gene therapies 

    An overview of gene therapies and how employers and health plans can manage spend while still focusing on individual care. 

    A balanced approach to member health for 2026 

     This covers a balanced strategy to managing physical, mental, and financial health, and how all three must be considered when it comes to overall member health. 

    Resources and events 

    Keep in touch with Truven online and on the road.


    Truven 2026 trends: What’s new with GLP-1s, gene therapy, and mental health

    It’s a familiar theme at this point: healthcare costs are again expected to rise in 2026, with some projections suggesting a nearly double-digit rise in employer healthcare costs.  

    There’s more pressure than ever for payers, employers, and benefits advisors to address healthcare costs and make sure that their chosen programs work. But how do you do that? How do you manage costs without reducing healthcare quality? How do you know the data you’re making health and wellness program decisions on is reliable?  

    Our 2026 healthcare trends webinar covered these topics. Experts from Truven's Analytics, Research & Solutioning team offered deep dives into the latest on GLP-1s and the explosive growth of gene therapies. They also discussed a foundational approach employers and payers can use to evaluate and support the physical, mental, and financial health of their populations. We’ll cover each of those trends in-depth in the rest of this spotlight. 

    Across the board, 2026 is shaping up to be one of the most expensive years we’ve seen in a decade. Health plan costs are hitting 10-year highs. Employers are bracing for increases anywhere between 7.6% and 10% in their total healthcare spend. Medical cost trend is holding steady at 8.5%—for the third year in a row. And pharmacy spend jumped by $50 billion in 2024 alone, more than twice the growth we saw the previous year. 

    So the cost curve isn’t flattening—it’s accelerating. And because of that, employers are pushing harder than ever for solutions that are lower cost, easier to navigate, and backed by real proof of value. 

    Notable trends from MarketScan® 

    When we look at 2025 data from our MarketScan Semi-Annual Norms, we’re seeing a 12.1% year-over-year increase in total medical and pharmacy spend per member per year, moving from about $7,600 to just over $8,600. It sets the context for why managing trend is becoming increasing challenging. 

    A major driver continues to be high-cost claimants. The top 1% of members account for almost 30% of total plan costs. On the pharmacy side, prescription drugs are up nearly 20%, and 19% of total Rx spend for the top 4 brand name drugs is now tied to GLP1 medications—specifically Wegovy, Oxzempic, Zepbound, and Mounjaro. These drugs are clinically effective, but the financial impact is substantial, and they represent one of the fastest growing cost categories we’re seeing across payers.   

    We’re also seeing meaningful increases in mental health services, with MHSA costs rising 15.5%. This aligns with national trends around continued demand for behavioral health support and increased utilization of outpatient therapy and related services. 

    IMG-Truven-Web-Q126-Spotlight-MSNtrends2

    The rest of the service categories show steady increases—inpatient, outpatient, radiology, labs—which collectively contribute to the upward pressure on overall trend and point to strategies such as site of care optimization. 

    All of this really reinforces why benchmarking is so important. Having this type of comparative data helps us understand how your population aligns to national trends or state or industry, where your cost drivers differ, and where we may need to prioritize strategic interventions. It equips us to target the areas that will have the greatest impact on managing cost growth moving forward. 

    Key takeaways: Building success in 2026 and beyond 

    This year is set to become one of the costliest years in the past decade – how do you build a successful future? You need three factors: 

    Data - Data strategy must evolve, emphasizing both the integration of new data sources and the effective use of healthcare benchmarking to guide decisions and control costs. 

    Analytics - Analytics must be both advanced and accurate – allowing for flexibility and adjustments, but built on a bedrock of expertise.  

    Partnerships - Industry experts and strong vendor partnerships are critical for the success of employers and payers – knowing how to influence trends and collectively work together towards a common goal.  

     See the replay here. 


    IMG-Truven-Trends-2026-Webinar

    Managing GLP-1s

    IMG-Truven-KatherineS-circle
    Katherine Shanahan
    Senior Pharmacy Analytic Advisor

    GLP-1s have been on the market for over 20 years now – with Byetta, the first GLP-1 approved back in 2005, but it’s only been in the last five or so years that we’ve seen exponential growth in utilization and spend. 

    The below graph shows MarketScan trends for patients per 1,000 and allowed PMPY spend for GLP-1 medications from 2013 to 2025. Along the X-axis at the bottom is a timeline of FDA approvals.

    IMG-Truven-Web-Blog-GLP1Trends

    We see utilization has skyrocketed from 4.8 patients per 1000 in 2013 up to 88.4 per 1,000 in 2025. Likewise, allowed PMPY spend has followed suit, rising from $13 PMPY in 2013 to $700 PMPY in 2025. 

    This rise is due to both GLP-1s becoming a standard of treatment for diabetes, only behind Metformin in utilization rates, and expanding into broader obesity and weight management treatment – especially in the last year or two where it has really gained momentum.  

    The GLP-1 pipeline  

    At the end of last year, we saw the first Obesity GLP-1 oral medication come to market – the Wegovy pill. Around March of this year we expect to see a second, Orforglipron, which will have a different brand name once approved. Possibly one other new GLP-1 will come to market in the second half of 2026 – Cagrisema, which is a dual agonist – combining semaglutide with amylin to produce very effective weight loss and blood glucose control in patients. 

    In 2027, there is likely to be a number of new approvals, some of which will compete directly with products currently on the market. This may lower costs, while others will offer new advances in cardiometabolic management, which will likely be priced higher. 

    In 2028, we expect our first specialty drug in this space, Bimagrumab, which when used with traditional GLP-1s can help focus weight loss on fat instead of muscle loss.  

    Finally, in 2029 and beyond we expect to see a duality of approvals. This includes the current headlining products going off patent and generics coming to market. Also, possibly gene and cell therapies that restore beta cell function, which is the primary driver behind insulin resistance and diabetes. 

    And payers are left asking what to do about this trend – are patients seeing clinical value in GLP-1 treatments? Is there an offset to cost or an ROI demonstrated through health improvement and mitigation of disease progression? Or should we be curbing this trend and reducing access? 

    The tightening of coverage or complete removal of obesity GLP-1s from formulary is a common trend across the industry. For payers that have dropped coverage in 2026 or are planning to in 2027, we recommend tracking the care of these individuals – do they migrate to other care options? Do we see a rebound in metabolic progression? And most importantly, are there opportunities to still support these patients though weight management? For example, some payers are exploring increasing HSA funding or wellbeing participation rewards that could be used by members to offset the cost of weight management treatment. 

    There are many different weight management programs and point solutions that have popped up in recent years, covering weight management and obesity, diabetes, and even into broader cardiometabolic management. These programs work in varying ways from digital and telephonic interaction, coaching, narrow prescribing networks, collecting biometric information, and more.  

    When considering a program or if you’re currently working with a program vendor, it’s important to consider how to integrate them into your benefits and with your other healthcare vendors.  

    This includes setting clear and defined engagement expectations: 

    • How do members navigate to the program? 

    • Are they encouraged to enroll through wellbeing reward? 

    • Or are they required to do so for access to GLP-1s?  

    You’ll also want to define specific behavior changes or improvements that you expect from the program. Do you expect participants to see better clinical outcomes? To improve adherence or persistence to treatment? Or possibly reduce treatment side effects through education and coaching?  

    Data collection is another key point to consider. This includes engagement data and any submitted biometric or survey data from the member. These data points help to understand how the program may be improving the outcome expectations set earlier as well as how improvements can happen in the future. 

    Lastly, but most importantly, you’ll want to consider how this program integrates with your other vendors. You don’t want it sitting out on an island. How does engagement data and biometrics get shared with the patient’s physician? How do we look holistically to better understand why some patients succeed in the program and others fail? Can we demonstrate that the outcomes for patients offset the costs for the program – producing an ROI and business case for leadership?  

    Quality and integrated data 

    Managing all the benefit intricacies, vendor impact, and patient outcomes takes quality, integrated data.  

    Integrating medical data with prescription data can help us understand if GLP-1s are being used off-label or if patients are missing medical care that is crucial for holistic treatment. We know GLP-1s garner high rebate amounts, but a lack of sight into that data piece can lead to a formulary that doesn’t align with value – especially as we look ahead to the expansion of product options in the future. 

    Setting clear and measurable expectations from vendors and programs helps show their ROI and impact on broader healthcare outcomes. Biometric and lab data helps show clinical improvement well before claims data, while productivity data demonstrates how health improvement can influence a patient beyond healthcare. Even survey and HRA data, which can be flawed in some cases, helps us understand the attitudes and behaviors of patients. That may help us tailor communication methods for benefit changes and approaches.  

    The integration of these data pieces help track a patient across their health journey – looking holistically at how various benefits impact their outcomes. 

    The next frontier: Gene therapies for metabolic disease

    IMG-Truven-KatherineS-circle
    Katherine Shanahan
    Senior Pharmacy Analytic Advisor

    As we look ahead to where the pharmaceutical market is going next, we’re seeing a significant increase in the number of drugs that fall under the umbrella of precision medicine – also known as personalized medicine.  

    There are different precision medicine subcategories: 

    • Targeted therapies, which target a specific protein like those that target the HER2 protein in breast cancer

    • Immunotherapies, like CAR-T medications, which amplify the patient’s immune system to combat diseases

    • Gene therapies, which deliver genetic material to the patient’s cell to change how that cell works 

     Gene therapy medications are often administered in the hospital setting – either inpatient or outpatient – so are covered through medical benefits. And while their costs can often reach hundreds of thousands to millions of dollars, the total cost for treatment exceeds beyond the cost of the drug due to the necessary wrap around care. In some cases, these medications can be simply infused so need only additional monitoring and supportive ancillary care. But for some gene therapies, especially ex vivo therapies, total care can involve inpatient stays at highly specialized hospitals.  

    Currently there are over 40 gene therapy products on the market, treating conditions like hemophilia, cancer, and many rare diseases. However, this area of medicine is expected to grow significantly over the next five years. 

    Here we’re looking at cell and gene therapy (CGT) spend and utilization in MarketScan from 2022 to 2025, including allowed PMPY and patients per 100,000. The timeline of FDA approvals is at the bottom along the X-axis. 

    IMG-Truven-Web-Q126-Spotlight-UtilizationCGTs

    Currently, 2025 appears a bit lower than expected, but this is likely due to incomplete data and the delay in payments for these sorts of claims. 

    And although these medications are very costly, their PMPY impact has remained relatively low due to the rare nature of the conditions they are approved for. But gene therapies are just beginning to pick up momentum. The utilization rate grew 42% and PMPY spend doubled from 2022 to 2024, and we’re expecting this to expand even further in the future. 

    Below is the drug pipeline for cell and gene therapies. This is showing the number of late-stage medications that are nearing FDA approval for gene therapies (green) cell therapies (blue) and gene-modified cell therapies, or GMCTs (purple) – broken out by the types of conditions they will treat.  

    IMG-Truven-Web-Q126-Spotlight-CGTPipeline

    It should be no surprise that oncology is one of the fastest growing areas with nearly 500 medications on the horizon for cell and gene therapies.  

    That is followed by neurological disorders, which includes medications for conditions like Parkinson’s and Alzheimer’s. 

    For metabolic disorders, there are numerous gene and cell therapies being developed for Type 1 Diabetes, with an expansion into Type 2 Diabetes likely. 

    Precise medication requires precise data 

    The advent of metabolic gene therapies represents a critical juncture for benefits management. By leveraging integrated data, enforcing rigorous clinical management, and preparing for the financial impact of precision medicine, health plans and employers can build sustainable benefit structures that support member health while managing escalating costs.  

    A balanced approach to member health for 2026

    IMG-Truven-Brandi-H-circle
    Brandi Hodor
    Senior Healthcare Analytic Advisor

    As we head into 2026, more employers and health plans are working to achieve a balanced approach for their members. The focus is being put on how we can balance the costs with the benefit, which is increasingly difficult as nearly one in five dollars spent in the U.S. economy goes toward healthcare. 

    Achieving balance requires payers to evaluate not only medical and pharmacy expenses, but also to further assess the interplay between physical and mental health, as well as financial considerations influencing member behavior.   

    Physical, mental, and financial health considerations 

    Physical health encompasses management of chronic conditions, such as diabetes and asthma, addressing weight-related issues, and even obtaining preventive healthcare services.  All of this helps to keep members healthy and avoid costly ER visits or admissions. 

    Common mental health issues, such as anxiety, depression, and substance abuse, have led to the 15%+ rise in MHSA PMPM that we have seen in our semi-annual norms. Additionally, members’ mental health may be impacted as they deal with family members who have chronic conditions such as cancer, or if they face the challenge of being a caregiver for adult children or aging parents. 

    The third piece of the puzzle is financial. Payers focus on helping their members and families achieve financial security, often providing options like 401(k) plans or Health Savings Accounts (HSAs). By storing this information in data warehouses, payers can track member contributions to these programs and identify the plans members choose to join. 

    Payers invest heavily in programs and vendors to support their members. As healthcare costs continue to rise annually, these initiatives are expected to increase.   

    Plan design versus neighborhood minority 

    Payers continually assess plan design to ensure it meets members' needs. Let’s look at preferred provider organizations (PPOs) and high-deductible health plans (HDPHs).  While both PPOs and HDHPs hold members accountable for usage, they produce different outcomes.  

    Market data factoring in the CDC’s Social Vulnerability Index based on the neighborhood minority percentile shows PPO members visit the ER more often across all neighborhoods than those with HDHPs. This directly impacts the shared costs for payers. Because PPOs do not require coordination by a primary care physician, this may result in reduced preventive care, limited chronic disease management, and an increased risk of conditions escalating into emergencies. 

    IMG-Truven-Web-Q126-Spotlight-PlanDesign

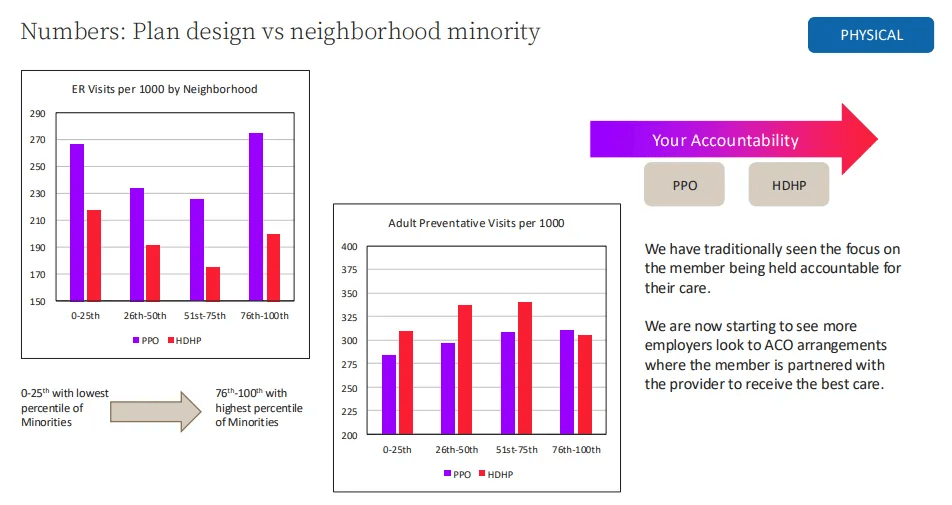
    Conversely HDHP members typically have higher rates of adult preventative visits per 1,000 compared to their PPO counterparts, regardless of demographics. This is likely because under federal rules, HDHPs must cover preventive services at no cost to the member — no deductible, no copay. This includes screenings, vaccines, and many early‑detection services. Because everything else in an HDHP is expensive until the deductible is met, members are strongly incentivized to take advantage of the free services they do get. Yet we see in the highest areas of minority, members are not taking advantage of these services. 

    Recently, more payers are exploring alternatives beyond traditional PPOs and HDHPs for employees and their families. 

    Evaluating best plan type 

    If we shift accountability from just PPO and high-deductible health plans to include providers—such as those in an accountable care organization (ACO), patient-centered medical home (PCMH), narrow network, or bundled payments—we can better share responsibility and manage costs. As a trend we are seeing more payers, and even specifically more employers, are exploring ACOs and value-based care models to guide members into these plans. 

    These models shift care away from volume and towards value, and the evidence behind them is getting harder to ignore. For payers, fewer avoidable ER visits and better chronic disease control translate directly into lower medical loss ratios. 

    These programs reward: 

    • Quality over quantity
    • Preventive care and early intervention
    • Cost‑efficient care pathways

    This aligns with payer strategies to control long‑term cost trends while improving member experience. 

    The risk of rising healthcare costs  

    One impactful method we recommend involves assessing the risk of rising healthcare costs. The Risk of Rising Cost model represents a prospective risk score that evaluates several factors. 

    Machine learning and artificial intelligence models play a critical role in this process. It is well-documented that a significant proportion of healthcare expenditures are attributed to a relatively small segment of the population. Recent MarketScan data demonstrates that, among individuals categorized as high-cost in any given year, approximately half do not remain in the highest-cost group in the following year. Therefore, accurately identifying and monitoring individuals at high risk—and implementing targeted interventions to manage costs—is essential for payers. 

    More than 400 variables drawn from medical, pharmacy, and eligibility data contribute to the model, including age, gender, disease categories, specific procedures, specialty medications, time-sensitive utilization metrics, and recent inpatient costs (e.g., average IP cost in the last three or six months). 

    Collectively, these features enable the model to predict the likelihood of rising costs, the probability of inpatient admission, primary risk drivers, and anticipated second-year expenditures at the individual patient level. 

    By utilizing models like the Risk of Rising Cost, organizations can more effectively target their value-based programs to positively influence members who are at risk for high costs. 

    Site of care optimization  

    An additional approach to addressing the substantial physical costs associated with member care is the implementation of site-of-care analytics. This capability remains one of the most significant yet underutilized tools in contemporary healthcare strategy. It sits at the intersection of cost, quality, and access, helping organizations understand where care is delivered, why, and how those choices affect outcomes and spending.  

    It’s the discipline of analyzing data to determine the most effective and efficient setting for delivering care. Organizations use this analysis to reduce unnecessary high‑cost utilization, improve patient experience, and optimize resource allocation. When applied specifically to site‑of‑care decisions, it enables:

    • Cost optimization: Identify procedures that can safely shift from inpatient to outpatient or ASC settings.
    • Quality improvement: Compare complication rates, readmissions, and outcomes across sites.
    • Patient access expansion: Understand geographic gaps that might exist.
    • Value‑based care performance: Align care settings with bundled payments, ACO goals, and risk‑based contracts.

     Some such use cases are:

    • Shifting elective surgeries to Ambulatory Surgery Centers
    • Optimizing infusion therapy sites
    • Managing high‑cost imaging utilization

    Our primary objective is not to eliminate services, but rather to ensure that care is provided in the most cost-effective setting. 

    Mental health  

    Since 2020, mental health has emerged as a significant priority among Payers. We examined PPO and HDHP across neighborhoods by percentile of minority populations. Neighborhoods with a lower percentage of minorities are marked in purple, while those with higher percentages appear in green. Notably, rates for mental health services increase up to the middle percentiles (26th–75th), then decline sharply in areas with the highest minority concentrations. This tells us that those that live in neighborhoods with the highest minorities are not receiving mental health services. This shows a lack of claims, not a lack of mental health need in a population.   

    IMG-Truven-Web-Q126-Spotlight-MHSA

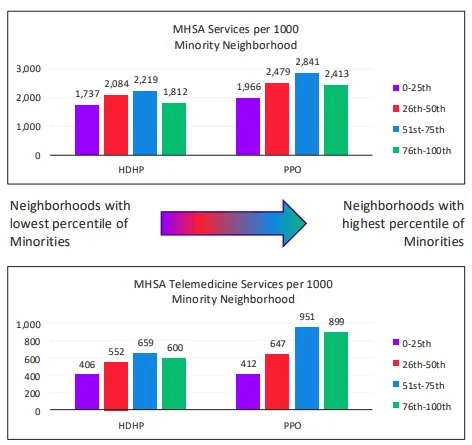
    According to the National Alliance on Mental Illness, 23.4% of U.S. adults experienced mental health conditions—a figure that continues to grow annually. This means that more than one in five adults are affected. Additionally, over 120 million Americans reside in federally designated mental health professional shortage areas. Telemedicine usage patterns reveal that individuals enrolled in HDHPs utilize these services far less than those with PPO coverage, regardless of neighborhood demographics.  

    Mental health has a notable impact on physical health—12.3% of emergency department visits made by U.S. adults annually are related to mental health conditions. Overall, serious mental illness accounts for $193.2 billion in lost earnings annually across the United States. Employers should prioritize addressing mental health in their workforce now, as its impact will only intensify in the years ahead. 

    Program participation 

    Many payers are now partnering with various programs aimed at improving mental health. As you engage with these different initiatives, consider the types of data you can collect—this information can help you better understand your population. By combining this data with claims data, you gain a fuller picture of overall wellbeing. Program participation data is particularly valuable, whether it’s from wellness programs, care management, or incentive programs. Understanding how people use your services helps inform your strategy and reveals where members are most engaged. This also allows you to evaluate ROI and make smarter decisions about future investments. 

    Program participation data consists of participation records by member by program, which can include identification method, participation start and end dates, and program activities.  

    Payers want to help their population:  

    • Remain healthy and productive  
    • Make lifestyle changes  
    • Manage chronic conditions effectively 

    As payers implement health programs to aid these efforts, they need to monitor the effectiveness and value of those programs to inform future strategy and ensure they’re targeting the right members. 
     
    Point solutions in healthcare 
     
    Evaluating point solutions in healthcare has become a mission‑critical skill for payers. The market is overflowing with vendors: there are 300+ solutions across 20+ categories, and most benefits teams are small. Without a disciplined evaluation framework, it’s almost impossible to separate meaningful impact from polished marketing campaigns. 
     
    To better understand whether your point solution is having an impact (either a Return on Investment or a Value on Investment), a point solution evaluation will measure the following three components of your program 

    • Engagement: Are the right people engaging? Are engagement strategies working? Are there barriers to enrollment? 
    • Behavior change: Is your solution addressing those areas it was intended to address (e.g., improved medication adherence, targeting mental health care)? 
    • Outcomes: Is there meaningful change in downstream outcomes among those who are participating in the intervention (e.g., lower costs, less unexcused call ins, reduced BMI)? 

    It is estimated that between $30-$50B is spent on healthcare point solutions every year.  Payers need to hold their solutions responsible for engaging the population and producing outcomes. By evaluating the point solutions you are using, you can better understand if they are delivering on their promise.   

    Financial data 

    Payers often collect extensive financial data but don’t always integrate it with medical information. Key data includes provider payments, salary, 401(k) and HSA contributions, program premiums, and other relevant metrics. Combining these sources in a data warehouse can offer a comprehensive view of each member. 

    True financial analytics in healthcare requires examining factors beyond claims, such as affordability and medical loss ratio. These insights impact financial performance and influence population health, benefit design, and care delivery. Integrating financial data allows for enhanced reporting and measurement. 

    Payers spend a lot on benefits, but they often don’t know whether those benefits are helping. Looking at financial indicators helps. 

    Employees who are financially stressed are more likely to experience: 

    • Lower productivity 
    • More absenteeism 
    • Higher turnover 
    • Greater use of mental‑health benefits 

    When payers look at HSA and 401(k) contribution patterns, they get a window into whether employees feel financially secure enough to save. Low participation can signal financial strain. It’s data‑driven benefits strategy instead of guesswork. 

    The key is that employers look at aggregate, anonymized data, not individual employee finances. The goal is to understand trends like: 

    • Are lower‑income employees unable to afford the deductible? 
    • Are younger employees not saving for retirement? 
    • Are certain groups opting out of HSAs because they don’t understand them? 

    These insights help employers build a healthier, more financially stable workforce. 

    Opportunity Scores 

    While we have examined solutions for physical, mental, and financial wellness separately, integrating all three domains establishes a comprehensive approach to overall well-being. Our clients often express the need to derive actionable insights from their extensive data, particularly at the member level. In response, we have created opportunity scores tailored to each client’s unique requirements. These scores are produced for every member, reflecting the data provided by clients and aligning with their specific business goals and priorities. 

    Conclusion 

    The pursuit of a balanced approach in 2026 involves clinical, financial, and regulatory variables. Employers and health plans must move beyond reactionary measures to proactive strategies that integrate pharmacy management, mental health support, and financial wellness into a cohesive ecosystem. 

    By leveraging data to understand the interplay between these factors and adopting structural models like ACOs, organizations can stabilize costs while improving the quality of life for their members. 

    Resources and events

    Blogs   

    Every month, the Truven Health Insights team discusses top news and issues in the healthcare industry, offering key perspectives from our team of experts.   

    Click here to read the latest.   

    Events  

    February 22-25 – ViVE 2026 in Los Angeles. The Truven team is excited to be returning to ViVE, which brings together digital health leaders across the industry. Find us at booth #V-1340 or reach out to your account team to schedule a meeting. 

    March 9-12 – HIMSS in Las Vegas. We’ll have Truven team members on site and available to meet, find us at the Merge by Merative booth (#4635). 

    March 17-18 - Conference Board in New York, April 16-17 – Conference Board in San Diego. Truven will have speaking sessions in New York and San Diego covering the foundation of a successful data strategy, with real-life use cases from Truven clients.  

    Let your Truven account team know if you are planning to attend these events!  

    About Truven  

    Truven by Merative is a portfolio of healthcare data and analytics solutions, backed by 40 years of deep healthcare expertise. We provide trusted insights and proven expertise to help employers, health plans, life sciences organizations, and government agencies drive better health and financial outcomes. With market-leading solutions like Health Insights and MarketScan, Truven serves 7 of the top U.S. health plans, over 40% of the Fortune 500, and the top 20 global pharmaceutical companies.   

    Learn more at merative.com/truven   

    Unlock Full Content

    ×

    Please complete this form to access the complete quarterly spotlight content.